Comparing Income to Average Years of Schooling at a Worldwide Scale

Lilian Law, Nina Jiang, Yijia Liu

GEOG 458 Advanced Digital Geographies: Group 03

Introduction

About the Project

This project uses three interactive maps to explore and visualize the relationship between education and income (how average years of schooling correlates with annual wages) across different countries in the world. The maps also highlight broad global patterns as well as regional differences.

Project Intent and Audience

The hope is that this project can serve as a simple but informative tool for understanding how educational attainment may be linked to economic outcomes and assist in teaching future educators and education administrators about this potential correlation between increased education years and higher income. The primary audience for this project includes government officials, especially those working in education or labor policy, as well as education administrators (such as superintendents), teachers, education researchers, students, and the general public who might be interested in learning about global inequality.

Project Inspiration

We used the following projects as initial inspiration for this project:

- Our World In Data project that visualizes global years of schooling by level of education and gender, with a time slider and pop-ups: https://ourworldindata.org/grapher/years-of-schooling?time=2023&metric_type=average_years_schooling&level=all&sex=both

- World Bank Group project that shows the adjusted net national income per capita (current US$), also with time slider and pop-ups when hovering to a country: https://data.worldbank.org/indicator/NY.ADJ.NNTY.PC.CD?view=map&year=2021

Additional Background

Tax Foundation, Education Levels, and Income

These two charts are from the Tax Foundation. Both of these charts show how earnings rise as the level of education goes up (in the U.S. in 2011). This provides a concrete example of the education-income relationship within a single country, and sets up the idea of a possible pattern that might appear globally. Andrew Lundeen states: "People with college degree tend to make much more income than those with high school degrees or less." (Andrew Lundeen, Educational Attainment Drives Level of Income, May 22, 2014). Link to source: https://taxfoundation.org/blog/educational-attainment-drives-level-income/

How to Use the Map Interface

This project has a time slider to change the data displayed (years ranging from 2000 to 2021 and by default shows data from the year 2000), a bar chart that can be hovered over to view data for selected country and three maps the user can interact with (a country can be clicked on to display the corresponding education and/or income data for it both via a pop up and on a bar chart in the left side panel), each denoted by one of the following three "tabs":

- Combined Data: Shows both education (years of schooling) data and adjusted net national income per capita (income) on the bar chart as well as the global average years of schooling and education and the percentage of schooling and income based on the world averages for that year of data (calculated by: ((years of schooling for selected country / worldwide average years of schooling) + (income for selected country / worldwide average income)) / 2). Note that for scaling purposes on the bar chart, income is shown in $1000 of US dollars and that any colors shown on this map were based on the income data which is why countries may change color depending on the year of data selected.

- Education: Will display a choropleth map. Shows only education data (years of schooling) both on the bar chart (shows years of schooling over all of the years) and on the map

- Income: Will display a choropleth map. Shows only adjusted net national income per capita both on the bar chart (shows income over all of the yaers) and on the map

×
  • Combined Data
  • Education
  • Income

Click a country

Adjusted Net National Income Per Capita:

Average Years of Schooling:

Showing Data for Year:

About the Data

Data

This project used three publicly available datasets. The dataset chosen to show the average years of education by country was a dataset from Our World Data called "average years of schooling" (average-years-of-schooling-among-adults.csv). The dataset chosen to show income data was titled "adjusted net national income per capita" (API_NY.ADJ.NNTY.PC.CD_DS2_en_csv_v2_7997.csv) from the World Bank Group. The third dataset called "world countries generalized" (World_Countries_(Generalized)_9029012925078512962.geojson) was from ArcGIS Hub, and was chosen for country shapes and for merging to the other datasets. The year range chosen was from 2000 to 2021 as it was the greatest range of data that was able to avoid the following problem: earlier and later data had incomplete entries or different numbers of countries which is not ideal when merging the initial schooling (education) and income data to the countries dataset. These datasets were chosen as they were easy to work with and contained sufficient data, specifically for country names as the data file for the countries from arcgis had 252 countries, and we wanted the data to have the same number of rows (or at least not missing too many countries) when being merged to the countries dataset.

Data Cleaning Choices and Results

Education Dataset (Average Years of Schooling Among Adults):

The original dataset “average-years-of-schooling-among-adults.csv” originally contained the following columns: Entity (country name), Code (three-character abbreviation of the country), Year (1960-2023), and Both genders (average years of schooling for both genders combined).

Income Dataset (Adjusted Net National Income Per Capita (Current US$)):

The original dataset “API_NY.ADJ.NNTY.PC.CD_DS2_en_csv_v2_7997.csv” originally contained the following columns: Country Name, Country Code (three-character abbreviation of the country), Indicator Name (Adjusted net national income per capita (current US$)), Indicator Code (abbreviation of indicator name), and year columns 1960-2024. It also has the first four rows showing Data Source and Last Updated Date (we cut out those 4 rows when loading data for cleaning).

World Countries Dataset (World Countries Generalized):

The original dataset “World_Countries_(Generalized)_9029012925078512962.geojson” originally contained the following columns: FID, COUNTRY, ISO (two digit ISO code for the country), COUNTRYAFF (the parent country the country is affiliated with), AFF_ISO (the two digit ISO code of the parent country affiliated with the country), and geometry (the polygon shape of the country).

Data Cleaning Choices

When cleaning the data we chose to keep only necessary columns, because there were many columns that were unncessary for the final visualization such as FID or ISO. Cutting those excess columns out helps keep the data organized and clean. Initially we cleaned and output three csv and three geojson files for each year, however later we realized it would be faster to just load everything from one data file (aka "merged_YEAR.geojson") and that using additional data files would require additional resources on the user's side which is not ideal as it makes the experience worse for them due to potential longer load times as more data is retrieved and loaded.

Dataset Columns per Dataset Kept After Merging and Cleaning

- merged_YEAR.csv (has no geometry column) and merged_YEAR.geojson contained the following columns and geojson properties: COUNTRY, geometry, INCOME, AVG_YR_SCH

- schooling_YEAR.csv (has no geometry column) and schooling_YEAR.geojson contained the following columns and geojson properties: COUNTRY, geometry, AVG_YR_SCH

- income_YEAR.csv (has no geometry column) and income_YEAR.geojson contained the following columns and geojson properties: COUNTRY, geometry, INCOME

File Structure

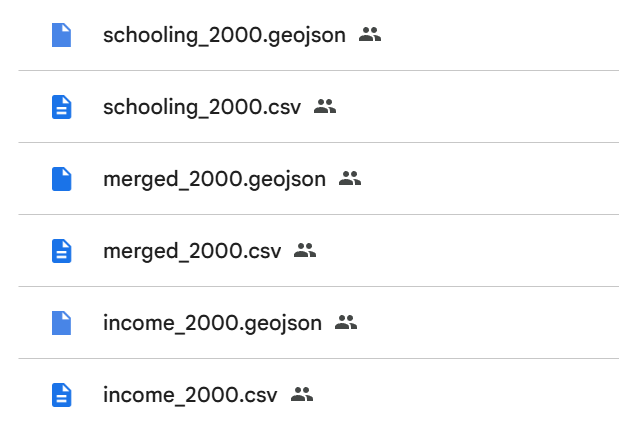
As a result of cleaning the data, the file structure ended up being as follows: assets/YEAR/(files for year, see image below)

The image above shows a screenshot from Google Drive of sample set of data files that can be found in a folder for a year of data. In this case the sample set is of data from the year 2000

Final Data Columns and Geojson Properties

- After cleaning the dataset, merged_YEAR.csv (has no geometry column) and merged_YEAR.geojson contained the following columns and geojson properties: COUNTRY, INCOME, AVG_YR_SCH, geometry

COUNTRY - country name

INCOME - adjusted net national income per capita (current US$)

AVG_YR_SCH - average years of schooling among adults both genders

geometry - location and polygon shape

Data Cleaning Process and About Missing Data Values

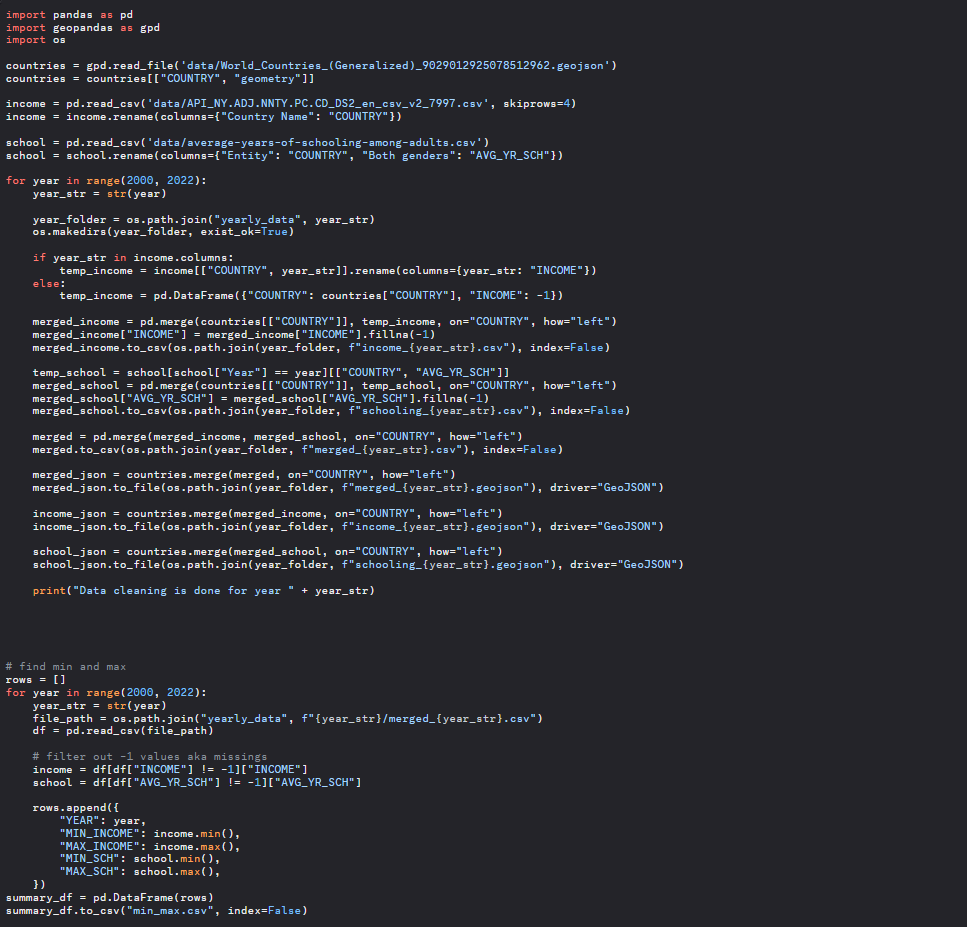
We used python for data cleaning as seen in the image below. In short, the script standardizes column names, aligns all datasets by year, fills missing values, and outputs the results to cleaned GeoJSON files for each year. If a value is missing from the dataset, we assign -1 to indicate missing data because it's much easier for the map and charts to process a real numeric value than a blank cell or a string like "NaN". We opted not to use 0 for missing data because 0 could be interpreted as a meaningful value (e.g., zero income or zero years of schooling), which would be misleading. These -1 values are shown as "No Data" in the maps.

View Data

Datasets Before Cleaning:

Average Years of Schooling Among Adults dataset from Our World in Data, which provides the average number of years adults aged 25 and older have spent in formal education: https://ourworldindata.org/grapher/years-of-schooling

Adjusted net national income per capita (current US$) from the World Bank Group, which provides comparable wage data (converted to USD using the 2024 rate) across many countries: https://data.worldbank.org/indicator/NY.ADJ.NNTY.PC.CD

World Countries Generalized from ArcGIS Hub for country shapes and for merging to datasets: https://hub.arcgis.com/datasets/esri::world-countries-generalized

Cleaned Data Folder:

Final Dataset Folder Post Cleaning Google Drive Link: https://drive.google.com/drive/folders/1dLkyqLmdP-t80cjHf4-kDiHQ1FnrYG1U?usp=drive_link

Acknoledgements, References, Sources, and AI Use Disclosure

Acknoledgments

We would like to Thank Bo Zhao and Liz Peng for their assistance in this project and throughout the GEOG 458 course.

References

For this project, there were multiple projects and labs we used as templates.

We used the following additional projects as inspriation and templates:

- To create the maps and rough draft of the side panel for the maps, lab 6 was used as a template and reference. Link to lab 6 (making a smart dashboard): https://github.com/jakobzhao/geog458/tree/master/labs/lab06

- To create the geonarraive layout (the slides without the maps), lab 7 was used as a template and reference. Link to lab 7 (making a map-based storytelling project): https://github.com/jakobzhao/geog458/tree/master/labs/lab07

- A 3D version of this map was attempted however time was limited and was unable to finish the 3d version of the maps. The orginal 3d project referenced was about resturant compaints in NYC. The project can be viewed here: https://labs.mapbox.com/bites/00304/

- The unfinished version of the 3d maps project GitHub repsository can be viewed here: https://github.com/liliml/geog-458-finalprojectprep3dmap-part2

- The unfinished version of the 3d maps project web interface can be viewed here: https://liliml.github.io/geog-458-finalprojectprep3dmap-part2/

Sources

The following sources were used and referenced for code, additional help, or for additional background:

- Source for background image: https://secretseattle.co/university-of-washington-ranking/

- w3schools source 1 referenced for side panel that opens and closes to view main maps: https://www.w3schools.com/howto/howto_js_collapse_sidepanel.asp

- w3schools source 2 referenced for side panel that opens and closes to view main maps: https://www.w3schools.com/howto/howto_js_collapse_sidebar.asp

- w3schools source 1 referenced for side panel map tabs to select a map to view: https://www.w3schools.com/css/css_navbar.asp

- w3schools source 2 referenced for side panel map tabs to select a map to view: https://www.w3schools.com/css/css_navbar_vertical.asp

- w3schools source 3 referenced for side panel map tabs to select a map to view: https://www.w3schools.com/css/css_navbar_horizontal.asp

- mapbox documentation referenced to create a time slider to select a year of data to show on the maps: https://docs.mapbox.com/mapbox-gl-js/example/timeline-animation/

- stackoverflow post referenced to make menu button appear in upper left of map: https://docs.mapbox.com/mapbox-gl-js/example/timeline-animation/

- w3schools source referenced to create icons for footer: https://www.w3schools.com/howto/howto_css_social_media_buttons.asp

- w3schools source 1 referenced to create and style side panel that opens and closes on click: https://www.w3schools.com/howto/howto_js_collapse_sidepanel.asp

- w3schools source 2 referenced to create and style side panel that opens and closes on click: https://www.w3schools.com/howto/howto_js_collapse_sidebar.asp

- w3schools source referenced for additional background and code on applying a background image to a webpage: https://www.w3schools.com/html/html_images_background.asp

- w3schools source 1 referenced for slider styling: https://www.w3schools.com/howto/howto_js_rangeslider.asp

- sitepoint source 2 referenced for slider styling: https://www.sitepoint.com/css-custom-range-slider/

- referenced this source for using flexbox and aligning images: https://developer.mozilla.org/en-US/docs/Web/CSS/Guides/Flexible_box_layout

- mozilla documentation referenced to make footer fit the bottom of the page: https://developer.mozilla.org/en-US/docs/Web/CSS/Reference/Values/fit-content

- mapbox documentation referenced for creating a time slider: https://docs.mapbox.com/mapbox-gl-js/example/timeline-animation/

- mozilla documentation referenced on how to use variables in a file path, in this project was used to put the current selected year variable into a file path and other parameters as the year changes: https://developer.mozilla.org/en-US/docs/Learn_web_development/Core/Scripting/Strings

- stackoverflow post referenced for additional background information about regarding using variables within strings: https://stackoverflow.com/questions/3304014/how-to-interpolate-variables-in-strings-in-javascript-without-concatenation

- mozilla documentation referenced to understand the parseInt function and this line of code and its parameters "let currSelYear = parseInt(e.target.value, 10);": https://developer.mozilla.org/en-US/docs/Web/JavaScript/Reference/Global_Objects/parseInt

- mozilla documentation referenced to understand the indexOf function: https://developer.mozilla.org/en-US/docs/Web/JavaScript/Reference/Global_Objects/Array/indexOf

- mapbox documentation source 1 referenced to update the current map according to the year selected: https://docs.mapbox.com/mapbox-gl-js/example/live-update-feature/

- stackoverflow post source 2 referenced to update the current map according to the year selected: https://stackoverflow.com/questions/63963704/refreshing-a-source-in-order-to-update-the-visualized-data

- mapbox documentation referenced to edit the offset property value and add the easing and animate properties to make side panel appear and disappear faster and smoother: https://docs.mapbox.com/mapbox-gl-js/api/properties/

- stackoverflow post referenced to add and remove classes from "buttons" or map tabs: https://stackoverflow.com/questions/507138/how-to-add-a-class-to-an-html-element-with-javascript

- stackoverflow post referenced for indexing through dictionaries: https://stackoverflow.com/questions/3337367/checking-length-of-dictionary-object

- mapbox documentation referenced for map projection and background for projection: https://docs.mapbox.com/mapbox-gl-js/guides/globe/

- c3 documentation for charts: https://c3js.org/reference.html

- tax foundation article and charts related to education level and income: https://taxfoundation.org/blog/educational-attainment-drives-level-income/

- geojson.io used for checking data files after cleaning: https://geojson.io/#map=2/0/20

- mapbox basemap (Mapbox Dark), chosen as it displays the color scheme of the maps nicely and creates a coherent appearance when combined with the panel style and color (an overall dark theme).: mapbox://styles/mapbox/dark-v10

AI Use Disclosure

For the initial template of lab 6 before this project, there was a button that did not work, and when a country was clicked the information for the country would not show up AI was used to assist in resolving this bug.